A week or two ago I wrote about Laguerre’s root-finding method and made some associated images. This post gives a couple more examples.
Laguerre’s method is very robust in the sense that it is likely to converge to a root, regardless of the starting point. However, it may be difficult to predict which root the method will end up at. To visualize this, we color points according to which root they converge to.
First, let’s look at the polynomial
(x − 2)(x − 4)(x − 24)
which clearly has roots at 2, 4, and 24. We’ll generate random starting points and color them blue, orange, or green depending on whether they converge to 2, 4, or 24. Here’s the result.
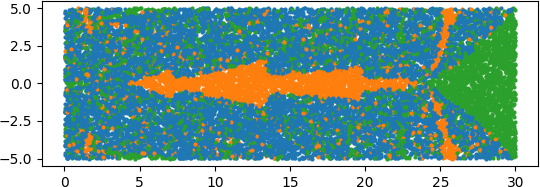
To make this easier to see, let’s split it into each color: blue, orange, and green.
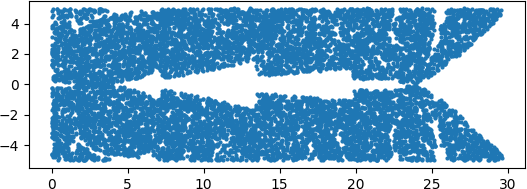
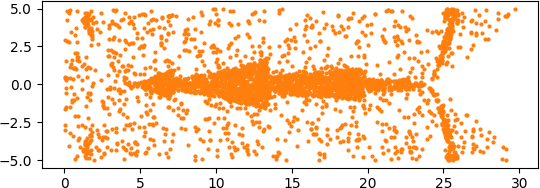
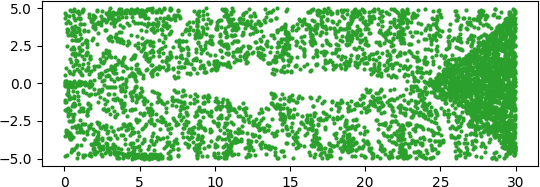
Now let’s change our polynomial by moving the root at 4 to 4i.
(x − 2)(x − 4i)(x − 24)
Here’s the combined result.
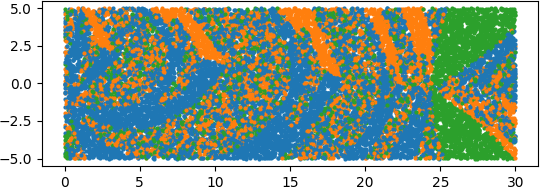
And here is each color separately.
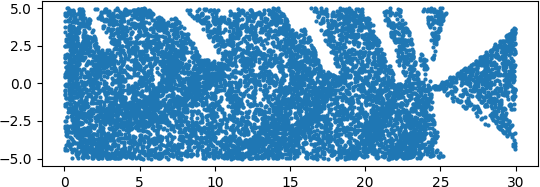
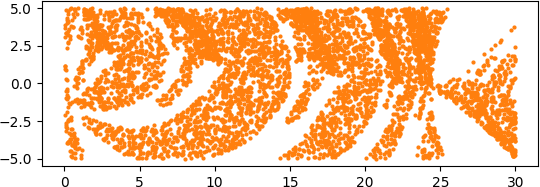
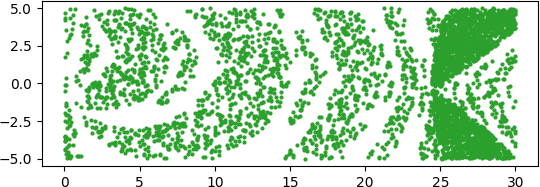
As we explained last time, the area taken up by the separate colors seems to exceed the total area. That is because the colors are so intermingled that many of the dots in the images cover some territory that belongs to another color, even though the dots are quite small.
The post More Laguerre images first appeared on John D. Cook.