Managing the garbage collector in Go, optimizing memory consumption in applications, and protecting against out-of-memory errors

Hello, my name is Nina Pakshina, and I work as a Golang developer at an online grocery delivery service. In this article, I will discuss managing the garbage collector in Go, optimizing application memory consumption, and protecting against out-of-memory errors.
Stack and Heap in Go
I won’t go into details about how the garbage collector works, as there are already many articles and official documentation on this topic (such as this and this). However, I want to mention some basic concepts that will help you understand the topic of my article.
You probably already know that in Go, data can be stored in two main memory storages: the stack and the heap.

Typically, the stack stores data whose size and usage time can be predicted by the Go compiler. This includes local function variables, function arguments, return values, etc.
The stack is managed automatically and follows the Last-In-First-Out (LIFO) principle. When a function is called, all associated data is placed on top of the stack, and when the function finishes, this data is removed from the stack. The stack does not require a complex garbage collection mechanism and incurs minimal overhead for memory management. Retrieving and storing data in the stack happens very quickly.
However, not all program data can be stored in the stack. Data that changes dynamically during execution or requires access beyond the scope of a function cannot be placed on the stack because the compiler cannot predict its usage. Such data is stored in the heap.
Unlike the stack, retrieving data from the heap and managing it are more costly processes.
What Goes in the Stack and What Goes in the Heap?
As I mentioned before, the stack is used for values with predictable size and lifespan. Some examples of such values include:
- Local variables are declared inside a function, such as variables of basic data types (e.g., numbers and booleans).
- Function arguments.
- Function return values if they are no longer referenced after being returned from the function.
The Go compiler considers various nuances when deciding whether to place data in the stack or the heap.
For example, pre-allocated slices up to 64 KB in size will be stored in the stack, while slices larger than 64 KB will be stored in the heap. The same applies to arrays: if an array exceeds 10 MB, it will be stored in the heap.

You can use escape analysis to determine where a specific variable will be stored.
For example, you can analyze your application by compiling it from the command line with the -gcflags=-m flag:
go build -gcflags=-m main.go
If we compile the following application main.go with the -gcflags=-m flag:
package main


func main() {
  var arrayBefore10Mb [1310720]int
  arrayBefore10Mb[0] = 1


  var arrayAfter10Mb [1310721]int
  arrayAfter10Mb[0] = 1


  sliceBefore64 := make([]int, 8192)
  sliceOver64 := make([]int, 8193)
  sliceOver64[0] = sliceBefore64[0]
}
The result would be:
# command-line-arguments
./main.go:3:6: can inline main
./main.go:7:6: moved to heap: arrayAfter10Mb
./main.go:10:23: make([]int, 8192) does not escape
./main.go:11:21: make([]int, 8193) escapes to heap
We can see that the arrayAfter10Mb array was moved to the heap because its size exceeds 10 MB, while arrayBefore10Mb remained in the stack (for an int variable, 10 MB equals 10 * 1024 * 1024 / 8 = 1310720 elements).
Additionally, sliceBefore64 was not sent to the heap because its size is less than 64 KB, whereas sliceOver64 was stored in the heap (for an int variable, 64 KB equals 64 * 1024 / 8 = 8192 elements).
To learn more about where and what gets allocated in the heap, you can study it here.
Thus, one way to deal with the heap is to avoid it! But what if the data has already landed in the heap?
Unlike the stack, the heap has an unlimited size and constantly grows. The heap stores dynamically created objects such as structs, slices, and maps, as well as large memory blocks that cannot fit in the stack due to its limitations.
The only tool for reusing memory in the heap and preventing it from being completely blocked is the garbage collector.
A Bit About How the Garbage Collector Works
The garbage collector, or GC, is a system designed specifically to identify and free dynamically allocated memory.
Go uses a garbage collection algorithm based on tracing and the Mark and Sweep algorithm. During the marking phase, the garbage collector marks data actively used by the application as live heap. Then, during the sweeping phase, the GC traverses all the memory not marked as live and reuses it.
The garbage collector’s work is not free, as it consumes two important system resources: CPU time and physical memory.
The memory in the garbage collector consists of the following:
- Live heap memory (memory marked as “live” in the previous garbage collection cycle)
- New heap memory (heap memory not yet analyzed by the garbage collector)
- Memory is used to store some metadata, which is usually insignificant compared to the first two entities.
The CPU time consumption by the garbage collector is related to its working specifics. There are garbage collector implementations called “stop-the-world” that completely halt program execution during garbage collection, resulting in CPU time being spent on non-productive work.
In the case of Go, the garbage collector is not fully “stop-the-world” and performs most of its work, such as heap marking, in parallel with the application execution.
However, the garbage collector still operates with some limitations and fully stops the execution of the working code multiple times within a cycle. You can learn more about it here.

How to Manage the Garbage Collector
There is a parameter that allows you to manage the garbage collector in Go: the GOGC environment variable or its functional equivalent, SetGCPercent, from the runtime/debug package.
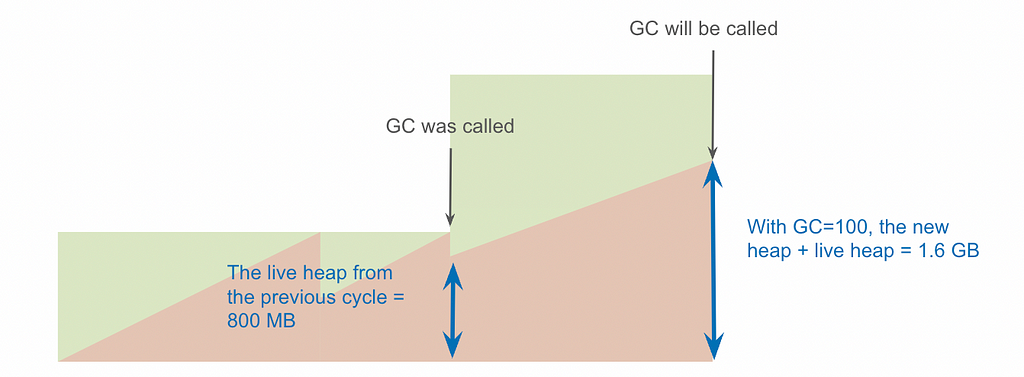
The GOGC parameter determines the percentage of new, unallocated heap memory relative to live memory at which garbage collection will be triggered.
The default value of GOGC is 100, which means garbage collection will be triggered when the amount of new memory reaches 100% of the live heap memory.

Let’s take an example program and track the changes in heap size using the go tool trace. We’ll use Go version 1.20.1 to run the program.
In this example, the performMemoryIntensiveTask function uses a large amount of memory allocated in the heap. This function launches a worker pool with a queue size of NumWorker and the number of tasks equal to NumTasks.
package main

import (
 "fmt"
 "os"
 "runtime/debug"
 "runtime/trace"
 "sync"
)

const (
 NumWorkers    = 4     // Number of workers.
 NumTasks      = 500   // Number of tasks.
 MemoryIntense = 10000 // Size of memory-intensive task (number of elements).
)

func main() {
 // Write to the trace file.
 f, _ := os.Create("trace.out")
 trace.Start(f)
 defer trace.Stop()

 // Set the target percentage for the garbage collector. Default is 100%.
 debug.SetGCPercent(100)

 // Task queue and result queue.
 taskQueue := make(chan int, NumTasks)
 resultQueue := make(chan int, NumTasks)

 // Start workers.
 var wg sync.WaitGroup
 wg.Add(NumWorkers)
 for i := 0; i < NumWorkers; i++ {
  go worker(taskQueue, resultQueue, &wg)
 }

 // Send tasks to the queue.
 for i := 0; i < NumTasks; i++ {
  taskQueue <- i
 }
 close(taskQueue)

 // Retrieve results from the queue.
 go func() {
  wg.Wait()
  close(resultQueue)
 }()

 // Process the results.
 for result := range resultQueue {
  fmt.Println("Result:", result)
 }

 fmt.Println("Done!")
}

// Worker function.
func worker(tasks <-chan int, results chan<- int, wg *sync.WaitGroup) {
 defer wg.Done()

 for task := range tasks {
  result := performMemoryIntensiveTask(task)
  results <- result
 }
}

// performMemoryIntensiveTask is a memory-intensive function.
func performMemoryIntensiveTask(task int) int {
 // Create a large-sized slice.
 data := make([]int, MemoryIntense)
 for i := 0; i < MemoryIntense; i++ {
  data[i] = i + task
 }

 // Latency imitation.
 time.Sleep(10 * time.Millisecond)

 // Calculate the result.
 result := 0
 for _, value := range data {
  result += value
 }
 return result
}
To trace the program’s execution, the result is written to the file trace.out:
// Writing to the trace file.
f, _ := os.Create("trace.out")
trace.Start(f)
defer trace.Stop()
By using the go tool trace, you can observe changes in heap size and analyze the behavior of the garbage collector in your program.
Please note that the precise details and capabilities of the go tool trace may vary across different versions of Go, so it is recommended to refer to the official documentation for more specific information on its usage in your particular Go version.
The Default Value of GOGC
The GOGC parameter can be set using the debug.SetGCPercent function from the runtime/debug package. By default, GOGC is set to 100 (percent).
Let’s run our program using the command:
go run main.go
After the program execution, a trace.out file will be created, which we can analyze using the go tool utility. To do this, execute the command:
go tool trace trace.out
Then we can access the web-based trace viewer by opening a web browser and navigating to http://127.0.0.1:54784/trace.

In the “STATS” tab, we see the “Heap” field, which displays how the heap size has changed during the execution of the application. The red area on the graph represents the memory occupied by the heap.
In the “PROCS” tab, the “GC” (garbage collector) field displays blue columns that represent the moments when the garbage collector is triggered.
Once the size of the new heap reaches 100% of the live heap size, garbage collection is triggered. For example, if the live heap size is 10 MB, the garbage collector will be triggered when the new heap size reaches 10 MB.
Tracking all garbage collector invocations allows us to determine the total time the garbage collector has been active.

In our case, with a GOGC value of 100, the garbage collector was invoked 16 times with a total execution time of 14 ms.
Invoking GC More Frequently
If we run the code after setting debug.SetGCPercent(10) to 10%, we will observe an increased frequency of garbage collector invocations. Now, the garbage collector will be triggered when the current heap size reaches 10% of the live heap size.
In other words, if the live heap size is 10 MB, the garbage collector will be triggered when the current heap reaches a size of 1 MB.

In this case, the garbage collector was invoked 38 times, and the total garbage collection time was 28 ms.

We can observe that setting GOGC to a value lower than 100% can increase the frequency of garbage collection, which can lead to increased CPU usage and decreased program performance.
Invoking GC Less Frequently
If we run the same program but with the debug.SetGCPercent(1000) setting at 1000%, we will get the following result:

We can see that the current heap grows until it reaches a size equal to 1000% of the live heap size. In other words, if the live heap size is 10 MB, the garbage collector will be triggered when the current heap size reaches 100 MB.

In the current case, the garbage collector was invoked once and executed for 2 ms.
GC is Turned Off
You can also disable the garbage collector by setting GOGC=off or using debug.SetGCPercent(-1).
Here is how the heap behaves with the garbage collector disabled without using GOMEMLIMIT:

We can see that with GC turned off, the heap size in the application is constantly growing until the program is executed.
How Much Memory Does the Heap Occupy?
In real memory allocation for the live heap, it usually doesn’t work as periodically and predictably as we see in the trace.
The live heap can dynamically change with each garbage collection cycle, and under certain conditions, spikes in its absolute value can occur.
For example, if the size of the live heap can grow up to 800 MB due to the overlap of multiple parallel tasks, the garbage collector will only be triggered when the current heap size reaches 1.6 GB.

Modern development often runs most applications in containers with memory usage restrictions. Thus, if our container has a memory limit set to 1 GB, and the total heap size increases to 1.6 GB, the container will fail with an OOM (out of memory) error.
Let’s simulate this situation. For example, we run our program in a container with a memory limit of 10 MB (solely for testing purposes). Dockerfile description:
FROM golang:latest as builder


WORKDIR /src
COPY . .


RUN go env -w GO111MODULE=on


RUN go mod vendor
RUN CGO_ENABLED=0 GOOS=linux go build -mod=vendor -a -installsuffix cgo -o app ./cmd/


FROM golang:latest
WORKDIR /root/
COPY --from=builder /src/app .
EXPOSE 8080
CMD ["./app"]
Description of Docker-compose:
version: '3'
services:
 my-app:
   build:
     context: .
     dockerfile: Dockerfile
   ports:
     - 8080:8080
   deploy:
     resources:
       limits:
         memory: 10M
Let’s launch the container using the previous code where we set GOGC=1000%.
To run the container, you can use the following command:
docker-compose build
docker-compose up
In a few seconds, our container will crash with an error corresponding to OOM (out-of-memory).
exited with code 137
The situation becomes quite unpleasant: GOGC only controls the relative value of the new heap, while the container has an absolute limit.

How to Avoid OOM?
Starting from version 1.19, Golang introduces a feature called “soft memory management” with the help of the GOMEMLIMIT option or a similar function from the runtime/debug package called SetMemoryLimit (you can read some interesting design details about this option here).
The GOMEMLIMIT environment variable sets the overall memory limit that the Go runtime can use, for example: GOMEMLIMIT = 8MiB. To set the memory value, a size suffix is used, in our case, 8 MB.
Let’s launch the container with the GOMEMLIMIT environment variable set to 8MiB. To do this, we’ll add the environment variable to the docker-compose file:
version: '3'
services:
 my-app:
    environment:
      GOMEMLIMIT: "8MiB"
   build:
     context: .
     dockerfile: Dockerfile
   ports:
     - 8080:8080
   deploy:
     resources:
       limits:
         memory: 10M
Now, when starting the container, the program runs without any errors. This mechanism was specifically designed to address the OOM problem.
That happens because after enabling GOMEMLIMIT=8MiB, the garbage collector is periodically invoked and keeps the heap size within a certain limit. This results in frequent garbage collector invocations to avoid memory overload.

What is The Cost?
GOMEMLIMIT is a powerful and useful tool that can also backfire.
An example of such a scenario can be seen in the Heap tracing graph above.
When the overall memory size approaches GOMEMLIMIT due to the growth of the live heap or persistent goroutine leaks, the garbage collector starts to be constantly invoked based on the limit.
Due to the frequent garbage collector invocations, the application’s runtime can increase indefinitely, consuming CPU time from the application.
This behavior is known as a death spiral. It can lead to the degradation of application performance, and unlike the OOM error, it is challenging to detect and fix.
That’s precisely why the GOMEMLIMIT mechanism works as a soft limit.
Go does not provide a 100% guarantee that the memory limit specified by GOMEMLIMIT will be strictly enforced. This allows for the utilization of memory beyond the limit and prevents the situation of frequent garbage collector invocations.
To achieve this, there is a limit set for CPU usage. Currently, this limit is set at 50% of all processor time with a CPU window of 2 * GOMAXPROCS seconds.
That’s why it should be noted that we cannot completely avoid OOM errors; they will occur much later.
Where to Apply GOMEMLIMIT and GOGC
If the default garbage collector settings are sufficient in most cases, the soft memory management mechanism with GOMEMLIMIT can protect us from unpleasant situations.
Examples of cases where using GOMEMLIMIT memory restriction can be helpful:
- When running an application in a container with limited memory, it is a good practice to set GOMEMLIMIT to leave 5–10% of available memory.
- When running resource-intensive libraries or code, real-time management of GOMEMLIMIT can be beneficial.
- When running an application in a container as a script (meaning the application performs some tasks for a certain period and then terminates), disabling the garbage collector but setting GOMEMLIMIT can enhance performance and prevent exceeding the container’s resource limits.
Cases to avoid using GOMEMLIMIT:
- Do not set memory limits when the program is already close to the memory limits of its environment.
- Do not use memory limitations when deploying in an execution environment you do not control, especially if your program’s memory usage is proportional to its input data. For example, if it is a CLI tool or a desktop application.
As we can see, with a thoughtful approach, we can manage fine-tuned settings in our program, such as the garbage collector and GOMEMLIMIT. However, it is undoubtedly important to carefully consider the strategy for applying these settings.
Thank you for reading.
Memory Optimization and Garbage Collector Management in Go was originally published in Better Programming on Medium, where people are continuing the conversation by highlighting and responding to this story.