The Mandelbrot set is the set of complex numbers c such that iterations of
f(z) = z² + c
remain bounded. But how do you know an iteration will remain bounded? You know when it becomes unbounded—if |z| > 2 then the point isn’t coming back—but how do you know whether an iteration will never become unbounded? You don’t.
So in practice, software to draw Mandelbrot sets will iterate some maximum number of times, say 5000 times, and count a point as part of the set if it hasn’t diverged yet. And for the purposes of creating pretty graphics, that’s good enough. If you want to compute the area of the Mandelbrot set, that’s not good enough.
A reasonable thing to do is to look at the distribution of escape times. Then maybe you can say that if an iteration hasn’t escaped after N steps, there’s a probability less than ε that it will escape in the future, and make ε small enough to satisfy the accuracy of your calculation.
The distribution of escape times drops off really quickly at first, as demonstrated here. Unfortunately, after this initial rapid drop off, it settles into a slow decline typical of a fat-tailed distribution. This is not atypical: a fat-tailed distribution might initially drop off faster than a thin-tailed distribution, such as the comparison between a Cauchy and a normal distribution.
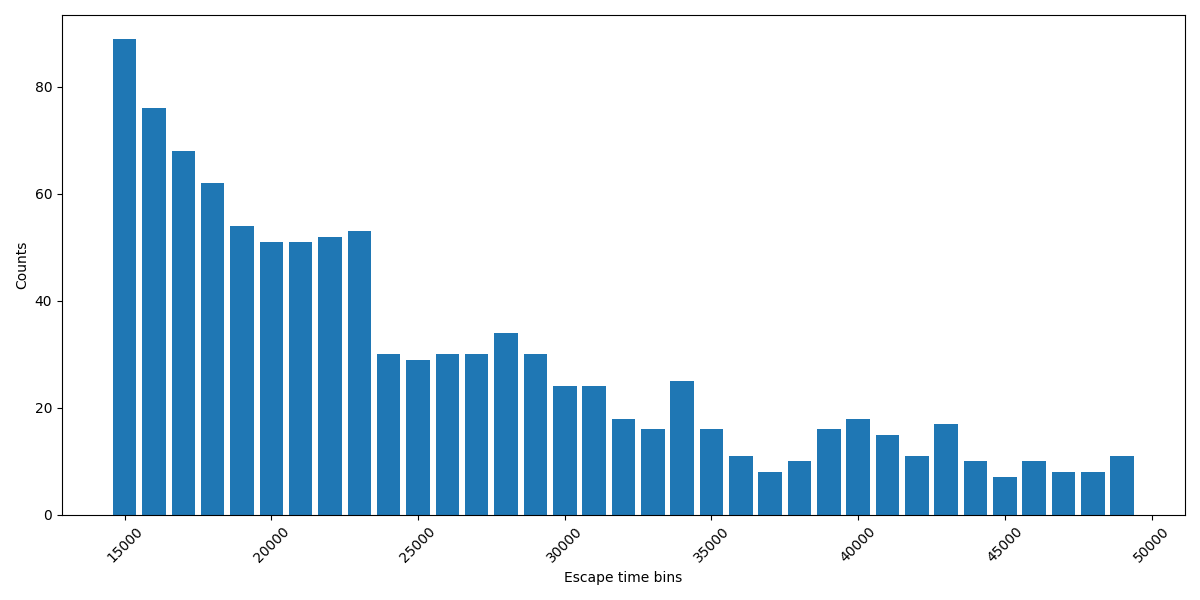
The plot above groups escape times into buckets of 1,000. It starts after the initial rapid decline and shows the fat-tailed region. This was based on 100,000,000 randomly generated values of c.
To estimate the probability of an iteration escaping after having remained bounded for N steps, you need to know the probability mass in the entire tail. So, dear reader, what is the sum of the areas in the bars not shown above and not calculated? It’s not like a normal-ish distribution when you can say with reasonable confidence that the mass after a certain point is negligible.
This matters because the maximum number of iterations is in the inner loop of any program to plot the Mandelbrot set or estimate its area. If 5,000 isn’t enough, then use 50,000 as the maximum, making the program run 10x longer. But what if 50,000 isn’t enough? OK, make it 100,000, doubling the runtime again, but is that enough?
Maybe there has been work on fitting a distribution to escape times, which would allow you to estimate the amount of probability mass in the tail. But I’m just naively hacking away at this for fun, not aware of literature in the area. I’ve looked for relevant papers, but haven’t found anything.
The post Mandelbrot and Fat Tails first appeared on John D. Cook.