Why do Venn diagrams almost always show the intersections of three sets and not more? Can Venn diagrams be generalized to show all intersections of more sets?
That depends on the rules you give yourself for generalization. If you require that your diagram consist of circles, then three is the limit. As John Venn put it in the original paper on Venn diagrams [1]
Beyond three terms circles fail us, since we cannot draw a fourth circle which shall intersect three others in the way required.
But Mr. Venn noted that you could create what we now call a Venn diagram using four ellipses and included the following illustration.
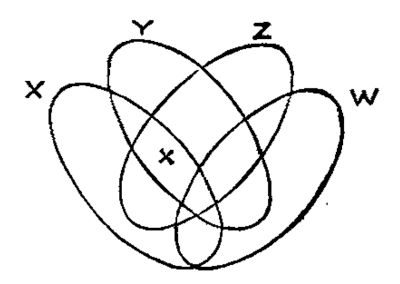
(It’s confusing that there is an X inside the diagram. Venn meant that to be an asterisk and not the same symbol as the X outside. He says in the paper “Thus the one which is asterisked is instantly seen to be ‘X that is Y and Z, but is not W’.” Maybe someone else, like the publisher, drew the diagram for him.)
So the answer to whether, or how far, it is possible to generalize the classic Venn diagram depends on permissible generalizations of a circle. If you replace circles with arbitrary closed curves then Venn diagrams exist for all orders. If you demand the curves have some sort of symmetry, there are fewer options. It’s possible to make a Venn diagram from five ellipses, and that may be the limit for ellipses.
A Venn diagram is a visualization device, and so an important question is what is the limit for the use of Venn diagrams as an effective visualization technique. This is an aesthetic / pedagogical question, and not one with an objective answer, but in my mind the answer is four. Venn’s diagram made from four ellipses is practical for visualization, though it takes more effort to understand than the typical three-circle diagram.
Although my upper bound of four is admittedly subjective, it may be possible to make it objective post hoc. A Venn diagram made from n curves divides the plane into 2n regions [2]. In order to use more than four curves, you either have to gerrymander the curves or else tolerate some regions being much smaller than others. The former makes the diagram hard to understand, and he latter makes it hard to label the regions.
I suspect that if you make precise what it means for a curve to be simple [3], such as using ellipses or convex symmetric curves, and specify a maximum ratio between the largest and smallest bounded regions, then four curves will be the maximum.
***
[1] John Venn. On the Diagrammatic and Mechanical Representation of Propositions and Reasonings. The London, Edinburgh, and Dublin Philosophical Magazine and Journal of Science. July 1880.
[2] This includes the outside of the diagram representing the empty set. The diagram shows the intersection of 0, 1, 2, …, n sets, and the intersection of no sets is the empty set. This last statement might seem like an arbitrary definition, but it can be justified using category theory.
[3] Simple in the colloquial sense, which is more restrictive than the technical mathematical sense of a simple curve.
The post Limitations on Venn diagrams first appeared on John D. Cook.